The idea: plan a short time box, then measure what got Done
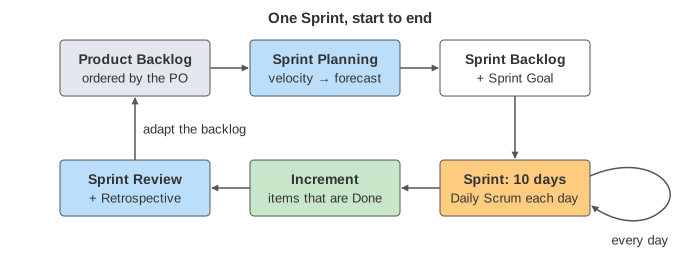
Scrum builds a product in Sprints: fixed time boxes of one month or less (two weeks, or 10 working days, on this page). A Scrum Team has three accountabilities. The Product Owner orders the Product Backlog, the list of everything the product might need. The Developers do the work. The Scrum Master helps the team use Scrum and gets impediments removed. Each Sprint starts with Sprint Planning, has a short Daily Scrum every day, and ends with the Sprint Review and the Sprint Retrospective. What comes out is an Increment: the items that meet the Definition of Done.
Story points
Each Product Backlog item (here a user story such as "Sign up") gets a size in story points. Points are relative: a 5 is about as big as another 5, and bigger than a 3. Teams often use 1, 2, 3, 5, 8, so that big items look rough on purpose. The Scrum Guide does not require points; it only asks that items are sized. On this page the team works in 2 pairs, and a pair finishes one point of work a day. That makes the demos easy to follow, but real points are not days.
| Product Backlog, top first | Points |
|---|---|
| Sign up, Log in, Reset password | 5, 3, 2 |
| Search, Cart, Checkout | 5, 3, 2 |
| Order history, Reviews, Admin report, Email alerts | 5, 3, 8, 5 |
| Mobile layout, Wish list, Coupons | 8, 5, 3 |
Sprint Planning by velocity
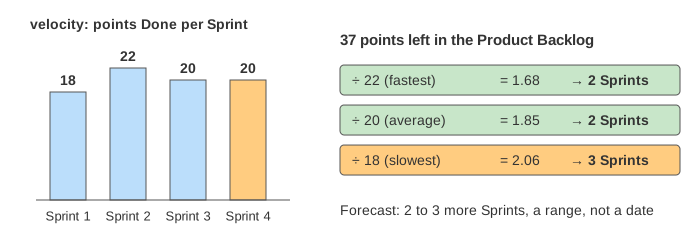
Velocity is the number of points a team got Done in a Sprint. Sprints 1 to 3 got 18, 22 and 20, so the average is 20. In Sprint Planning the Developers use that past number to forecast how much fits, rather than a wish. They take items from the top of the Product Backlog: 5 + 3 + 2 + 5 + 3 + 2 = 20. The next item, Order history (5), would make 25, so it stays. Those 6 items are the Sprint Backlog, together with a Sprint Goal: "a shopper can sign up, find a product and pay" (Demo: Sprint Planning by velocity).
The Product Owner decides the order. The Developers decide how much they can take on.
The board and the Daily Scrum
The board shows the Sprint Backlog in three columns: To Do, In Progress and Done. Every morning, at the Daily Scrum, a pair with nothing in hand takes the top item from To Do. An item moves to Done only when it meets the Definition of Done: built, tested, ready to ship. Pair 1 holds Sign up for 5 days. Pair 2 finishes Log in on day 3, then Reset password on day 5.
The burndown chart
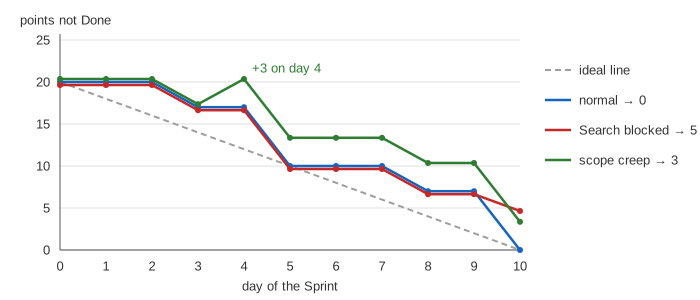
A burndown chart plots, at the end of each day, the points of the Sprint Backlog that are not Done. The ideal line is straight. It runs from the planned total on day 0 to 0 on the last day: 20 points over 10 days is 2 points a day.
Points burn only when an item is Done. Sign up at 4 of 5 counts as 0 Done. So the real line falls in steps, and it sits above the ideal line while big items are open. In the normal Sprint it reads 20, 20, 20, 17, 17, 10, 10, 10, 7, 7, 0. It is above the ideal line most days, yet it ends on time (Demo: a whole Sprint). Smaller items give a smoother line.
A blocked story and scope creep
A blocked item cannot move. In the demo Search waits 3 days (days 7 to 9) for an outside team. Pair 1 raises it at the Daily Scrum, and the Scrum Master works to remove the impediment. Search ends at 2 of 5, so its 5 points are still not Done on day 10.
Scope creep is work added during the Sprint. On day 4 a stakeholder asks for a Promo banner (3), and the line jumps from 17 to 20. The Scrum Guide says scope may be clarified and renegotiated with the Product Owner as more is learned. But no change may put the Sprint Goal at risk. In the demo nobody takes anything out, so the banner is never started.
| Sprint | Burndown, day 0 to 10 | Not Done | Velocity |
|---|---|---|---|
| normal | 20 20 20 17 17 10 10 10 7 7 0 | 0 | 20 |
| Search blocked | 20 20 20 17 17 10 10 10 7 7 5 | 5 | 15 |
| Promo banner added | 20 20 20 17 20 13 13 13 10 10 3 | 3 | 20 |
| 25 planned | 25 25 25 22 22 15 15 15 12 12 5 | 5 | 20 |
The Sprint is never made longer. On day 10 it ends. Items that are not Done go back to the top of the Product Backlog, and the Product Owner orders them again. Planning 25 points (5 above the average) does not make the team faster. It still gets 20 Done and leaves Order history untouched (Demo: over-commit).
Velocity and the forecast
After the Sprint Review the new velocity joins the history. Divide the points left in the Product Backlog by the velocity and round up. That gives the number of Sprints still needed. Use the slowest and the fastest Sprint too, so the answer is a range, not a promise.
| After | Velocity history | Points left | Fastest | Average | Slowest |
|---|---|---|---|---|---|
| normal Sprint | 18, 22, 20, 20 | 37 | 22 → 2 | 20 → 2 | 18 → 3 |
| blocked Sprint | 18, 22, 20, 15 | 42 | 22 → 2 | 18.75 → 3 | 15 → 3 |
After the blocked Sprint, Search (5) is back in the Product Backlog, so 42 points are left, and the average falls to 18.75 (Demo: forecast after the blocked Sprint). The next Sprint Planning forecasts 18 points. Velocity measures one team on its own scale. It is not a score to compare teams.
Scrum plans by value and size, not by a task network. When the order of the work matters, see also the critical path method, which finds the tasks that set the end date and how much slack the others have.
See also earned value management, where work counts by its budget when it is done, and SPI and CPI tell time and cost apart.
What the page leaves out
How points are estimated (Planning Poker, comparing with a reference item); splitting big items and breaking items into tasks; the Product Goal; Product Backlog refinement; burnup charts, which show added scope as a separate line; cumulative flow diagrams and Kanban WIP limits; what a team really does while blocked (help another pair, swarm on one item); a changing team size, holidays and sick days; and a Sprint cancelled by the Product Owner when its goal becomes obsolete.