What a garbage collector does
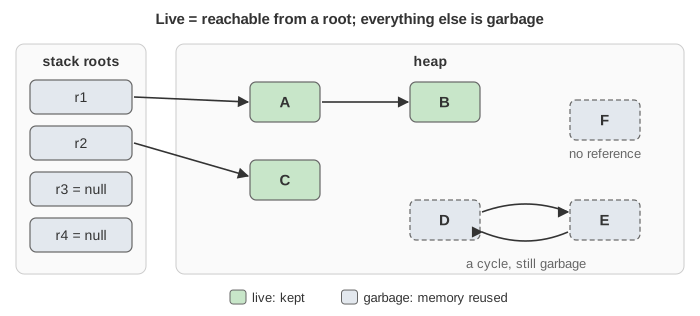
A Java program allocates objects with new and never frees them. The JVM's garbage collector finds the objects the program can no longer reach and reuses their memory. An object is live if a chain of references leads to it from a root: a local variable on some thread's stack, a static field, a JNI handle. Everything else is garbage, however it got there.
Where objects and references live before any collector runs (thread stacks, frames, TLABs, object headers): Stack vs Heap in Java.
Every collector does two jobs: find the live objects (by tracing from the roots) and reclaim the rest (by sweeping, or by copying the live objects away and reusing the whole area). The collectors differ in when they do this and whether the program has to stop while they do. A stop is called a stop-the-world (STW) pause: every application thread halts at a safepoint until the GC says go.
How to use the animation
- The program has four stack roots
r1..r4. Each object has one reference field,next. Abyte[]takes two slots and has no reference field. - target = new Object() allocates an object and stores it in target: a root (
r1) or an object's field (AmeansA.next). target = value stores value (null, a root or an object). read target.next loads a field, which matters for ZGC's load barrier. - An object nothing reaches turns grey: that is the truth the collector has to discover. Trigger GC runs the collector's normal collection, System.gc() a full one, GC step gives the concurrent GC threads one more quantum of work.
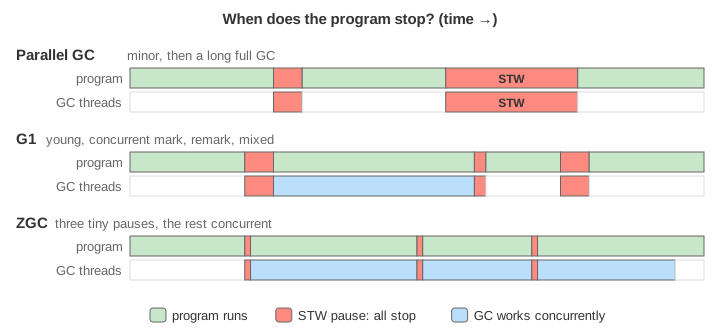
- The timeline shows what the program and the GC threads do over time: green, the program runs; red, a stop-the-world pause; blue, GC work done concurrently. The panel at the top right keeps pause statistics for each collector, so Demo: same program, 3 collectors ends with a direct comparison.
- Times are illustrative units, not milliseconds; the heap is 48 slots, not gigabytes. The shape of the costs is the point: what a pause is proportional to.
The generational hypothesis
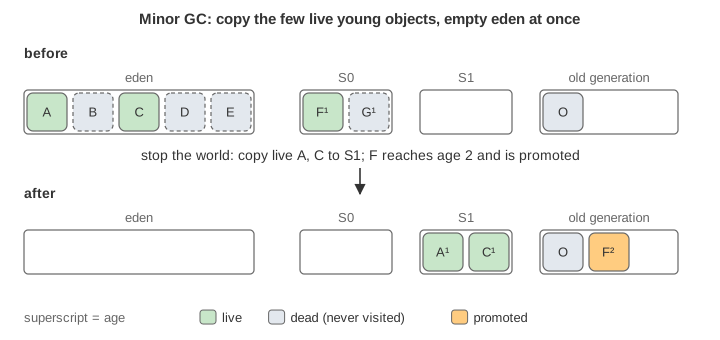
Most objects die young: a temporary string, an iterator, a request object. A few live for the whole run: caches, configuration, connection pools. Generational collectors exploit this. New objects go to a small young generation that is collected often. Since almost everything in it is dead, collecting it by copying the few survivors out is cheap: the cost depends on the live objects, and the garbage is never even visited. Objects that survive several young collections are promoted (tenured) to the old generation, which is collected rarely.
One problem: an old object may point to a young one, and a young collection must not scan the whole old generation to find such pointers. So every store of a reference into an object runs a small piece of code, a write barrier, that marks the 512-byte card of the old object as dirty. A young GC scans only dirty cards. A side effect, shown in Demo: minor GC on the Parallel GC tab: a dead old object on a dirty card still keeps its young target alive until the old generation is collected.
Parallel GC: throughput first
java -XX:+UseParallelGC -Xmx4g App

heap:  [ eden | S0 | S1 ]  [ old generation ]
         young generation
- Allocation is a pointer bump in eden (each thread has its own chunk, a TLAB, so no locking).
- Minor GC when eden is full: stop the world; trace from the roots and dirty cards through young objects only; copy each live one into the empty survivor (to) with its age plus one, or promote it to old when its age reaches the tenuring threshold (15 by default, 2 in the animation) or the survivor overflows. Eden and the from survivor are then empty, and the survivors swap roles.
- Full GC when old gen fills up (or would not have room for the promotions): stop the world; mark the whole heap; slide the live objects of old gen together (mark-compact). This pause is proportional to all live data: seconds on a big heap.
- All phases use many GC threads in parallel (hence the name), but there is no concurrent phase: the program never runs while the GC works. That makes Parallel GC the most efficient collector in total CPU, and a good choice for batch jobs, where only throughput matters.
G1: pause-time goals with regions
java -XX:+UseG1GC -XX:MaxGCPauseMillis=200 App      (the default since JDK 9)

heap:  [E][E][S][O][O][H][ ][O][ ][E] ...   2048 or so equal regions, 1-32 MB each
- The heap is a grid of equal regions. Each is free, eden, survivor, old or humongous; the generations are just sets of regions, and their sizes can change after every GC. G1 sizes the young generation so that a young GC fits the pause goal.
- Young GC (an evacuation pause): stop the world, copy the live objects of the collection set (all eden and survivor regions) into new survivor or old regions, and free the whole collection set. Each region has a remembered set listing where outside pointers into it come from, so the GC does not scan other regions.
- Humongous objects, half a region or more, get contiguous regions of their own and are never copied. Short-lived big arrays are expensive in G1; unreferenced ones are at least reclaimed eagerly at the next young GC.
- Concurrent marking starts when old occupancy crosses the IHOP (Initiating Heap Occupancy Percent, 45% by default, adaptive). A Concurrent Start young GC marks the roots; marking then runs in GC threads while the program runs. To stay correct while the program keeps changing pointers, G1 uses snapshot-at-the-beginning (SATB): a pre-write barrier records the old value of every overwritten reference, so everything live at the start gets marked. Objects allocated during marking count as live. The price is floating garbage: an object that dies during marking survives this cycle (the demo shows one).
- Remark (short STW) finishes marking; Cleanup (short STW) counts live bytes per region and frees fully dead regions at once.
- Mixed GCs: the next young GCs also evacuate some old regions, those with the most garbage first. That is the name: Garbage First. Old gen is compacted a few regions at a time, never all at once.
- If G1 still runs out of space (evacuation failure, humongous fragmentation), it falls back to a Full GC, a parallel STW mark-compact of the whole heap.
ZGC: pauses that do not grow with the heap
java -XX:+UseZGC -Xmx16g App (generational by default since JDK 23)
Parallel GC and G1 must stop the program to move objects, because every pointer to a moved object has to be fixed before the program uses it. ZGC moves objects while the program runs. Two tricks make that possible:
- Coloured pointers. A 64-bit reference has spare bits; ZGC stores metadata in them: Marked0, Marked1 and Remapped. At any moment exactly one colour is good. The animation draws each arrow in its pointer's colour, so you can see which pointers are good.
- A load barrier. Every time the program loads a reference from the heap, a few instructions check its colour. Good colour: continue (the fast path, nearly free). Bad colour: the slow path fixes it. If marking runs, the object is marked; if the object has moved, the new address is looked up in a forwarding table; if it is about to move and has not yet, the program's own thread copies it. Then the good pointer is written back into the field (self-healing), so each stale pointer costs at most one slow path.
A cycle, as in Demo: concurrent cycle on the ZGC tab:
Pause Mark Start          flip the good colour (M0 ↔ M1); mark roots        STW, tiny
Concurrent Mark/Remap     trace the heap; fix pointers left stale by the    concurrent
                          previous cycle's relocation
Pause Mark End            marking done                                      STW, tiny
Concurrent Prepare        free pages with nothing live; pick the pages
                          with the most garbage: the relocation set         concurrent
Pause Relocate Start      good colour = Remapped; relocate what roots
                          point at                                          STW, tiny
Concurrent Relocate       copy live objects out, fill forwarding tables     concurrent
The three pauses only touch roots, so they take well under a millisecond whether the heap is 100 MB or 16 TB. The cost moves elsewhere: the barrier on every load, GC threads competing for CPU, and memory headroom. If the program allocates faster than a cycle frees memory, it gets an allocation stall (Demo: allocation stall on the ZGC tab): the thread waits for the cycle to finish, which is exactly the latency ZGC exists to avoid. ZGC wants spare heap and spare cores.
Since JDK 21 ZGC can be generational (the only mode since JDK 24): it keeps a young and an old generation and runs the same concurrent machinery on each, so it no longer has to mark the whole heap to reclaim short-lived objects. The animation shows the single-generation algorithm, whose mechanism is the same.
Comparison
| Parallel GC | G1 | ZGC | |
|---|---|---|---|
| Heap layout | contiguous young (eden + 2 survivors) and old | equal regions, generations as sets of regions | pages of 2 MB / 32 MB / larger, generational since JDK 21 |
| Young collection | STW copying | STW evacuation of young regions | concurrent (generational ZGC) |
| Old collection | STW mark-compact of the whole old gen | concurrent marking, then STW evacuation of a few regions per mixed GC | concurrent marking and concurrent relocation |
| Pause grows with | live data (full GC: the whole heap) | live data in the collection set, kept near the pause goal | roots only; typically < 1 ms |
| Barriers | card-marking write barrier | SATB pre-write + remembered-set post-write barriers | load barrier (and store barriers in generational mode) |
| Throughput | highest | good | lower: barrier and concurrent CPU |
| Best for | batch jobs, small heaps, maximum throughput | general servers: the balanced default | latency-sensitive services, large heaps |
Choosing and tuning
- Start with the default (G1) and set only the heap size (
-Xmx) and, if needed, a pause goal (-XX:MaxGCPauseMillis). Measure with GC logs:-Xlog:gc*:file=gc.log. - If pauses of tens of milliseconds are too long, try ZGC and give it headroom. If only total run time matters, try Parallel GC.
- Frequent Full GCs usually mean the live data does not fit the heap (or there is a leak): no collector can fix that. A growing old generation after every full GC is the classic sign of a memory leak.
- Serial GC (
-XX:+UseSerialGC, one thread, all STW) is chosen by default on very small machines. Shenandoah is another concurrent-compacting collector, using forwarding pointers and barriers much like ZGC.