What happens when you type java -jar hello.jar world
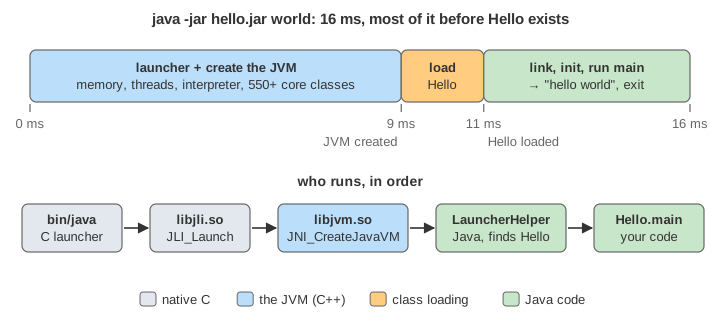
The program-loading page ends when a native program reaches main. For a Java application that is where the work begins: the native program is only the launcher, bin/java. It loads the JVM as a shared library, builds a whole runtime (memory areas, threads, hundreds of core classes, an interpreter), and only then reads the application's first class and interprets its first bytecode.
How Hello.class itself is made from source, and how the interpreter runs bytecode on frames and an operand stack, is on How a Java Program Is Compiled and Run.
The animation follows this program, run on Temurin JDK 21 in a container with 4 CPUs and 5.9 GB of memory. The file sizes, class counts and their sources, the threads, the memory reservations, the timings and the error messages on the canvas were captured from real runs (with -Xlog, strace, jstack and Native Memory Tracking).
public class Hello {                                  // javac Hello.java
    static int counter = 1;                           // jar cfe hello.jar Hello Hello.class
    public static void main(String[] args) {
        System.out.println("hello " + args[0]);
    }
}
Reading the canvas
- Left: the function running now (C++ in the JVM, C in the launcher, or Java), the launcher's decisions and the ergonomics, the three class loaders with the number of classes each has defined, the life cycle of class
Hello, and its bytecode with the interpreter's position (▶) and operand stack. - Middle: the process's threads as they start: grey for the JVM's internal C++ threads, green for Java threads.
- Right: the big areas of the address space with their reserved size and how much is committed.
- Bottom: the JVM's own
-Xloglines and counters, then a line: everything above it runs in user space. Below it, in kernel space, are the system calls, the only way the process asks the kernel for anything (files, memory mappings, threads). The counters are: classes by source, threads, JIT-compiled methods, and the time sinceexecve(measured at a few points and interpolated between them).
Next Stage runs one stage and Run to main() runs up to main's first bytecode. Each tab starts its program at once; a change of CDS or GC starts the open program again with the new option, and Reset starts it again as it is.
1. The launcher: a small C program
bin/java is 71 KiB. Its main calls JLI_Launch in libjli.so, which:
- expands
@argfilesand theJDK_JAVA_OPTIONSvariable, and splits the command line: options before the main class (or-jarfile) are for the JVM, the rest formain; - for
-jar, opens the jar with its own small zip reader and readsMain-ClassfromMETA-INF/MANIFEST.MF. A jar without one fails right here, in C: no main manifest attribute; - reads
lib/jvm.cfgto choose the VM (server) anddlopenslib/server/libjvm.so, 25 MB of C++ that contains the whole JVM; - starts a new thread with the
-Xssstack size and runsJavaMainon it. The process's first thread only waits inpthread_join. So the Java thread called "main" is not the process's main thread.
The launcher talks to the JVM only through the JNI Invocation API (JNI_CreateJavaVM, CallStaticVoidMethod, DestroyJavaVM), the same API any C or C++ program can use to embed a JVM.
2. Creating the JVM
Ergonomics. The JVM first measures the machine, and in a container it reads the cgroup limits (cpu.max, memory.max), not the host's. With at least 2 CPUs and 1792 MB it counts as a server-class machine and uses G1; otherwise Serial. The default heap is 1/64 of memory initially and 1/4 at most (94 MB and 1478 MB here), and the GC and JIT thread counts follow the CPU count. java -XX:+PrintFlagsFinal -version shows every value it chose.
Reserve, then commit. The heap is reserved as one block of address space and only the initial part is committed. Even committed memory costs nothing until it is touched. Placing a heap under 32 GB low in the address space makes compressed oops cheap: a reference is 32 bits, and below 4 GB it is the address itself. Class metadata lives outside the heap, in metaspace and a 1 GB compressed class space. Machine code from the JIT goes to the 240 MB code cache. In total this run reserves about 2.9 GB and commits about 160 MB, and about 70 MB is actually resident.
| Area (NMT, this run) | Reserved | Committed |
|---|---|---|
| Java heap | 1478 MB | 96 MB |
| Class (compressed class space + metaspace) | 1088 MB | 0.5 MB |
| Code cache | 242 MB | 7.4 MB |
| GC data (G1 card table, remembered sets …) | 70 MB | 43 MB |
| Thread stacks (18 threads) | 26 MB | 0.7 MB |
| CDS archive | 16 MB | 12.7 MB |
| Total (including malloc) | 2.9 GB | 162 MB |
Threads. Then come the GC threads (G1's workers, concurrent markers, refinement), the VM thread (every stop-the-world operation runs on it), and after the core classes are loaded, the JVM's own Java threads: Reference Handler, Finalizer, Signal Dispatcher, the C1 and C2 compiler threads, Common-Cleaner and others. jstack on any JVM shows them.
The interpreter is generated at startup. HotSpot's template interpreter is not compiled C++: at startup the JVM writes machine code for every bytecode into the code cache, in about a quarter of a millisecond.
3. The core classes and CDS
Before your class, the JVM loads over 550 of its own: Object, String, System, Thread, the module system, class loaders, and for -jar the zip and jar code. They all come from lib/modules, a 136 MB jimage file that holds every JDK class (it replaced rt.jar in Java 9).
Class Data Sharing keeps them in lib/server/classes.jsa already parsed and laid out as the JVM's own data structures, together with archived heap objects such as the module graph and interned strings. The archive is mapped into memory, and loading an archived class is little more than registering it. In this run:
| CDS on (default) | -Xshare:off | |
|---|---|---|
Classes loaded (-jar) | 645 (643 from the archive) | 680 (678 parsed from lib/modules) |
| JVM created | ≈ 9 ms | ≈ 18 ms |
Hello loaded | 11 ms | 22 ms |
| Wall time | 16 ms | 30 ms |
You can archive your own application's classes too: java -XX:ArchiveClassesAtExit=app.jsa -jar app.jar once, then java -XX:SharedArchiveFile=app.jsa -jar app.jar. Project Leyden (JDK 24+, -XX:AOTCache) goes further and also stores linked classes and profiles.
4. Loading, linking and initialising a class
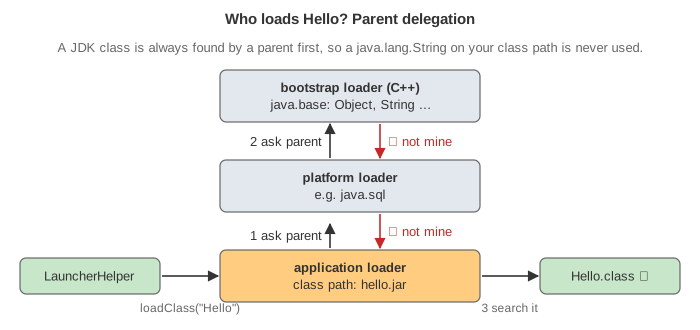
Loading, by parent delegation. LauncherHelper, which is Java code, asks the application class loader for Hello. That loader first asks its parent, the platform loader, which asks the bootstrap loader (C++, inside the JVM, for java.base and the other core modules). Only when both parents answer "not mine" does the application loader search the class path. That is why a java.lang.String on your class path is never used. The bytes then go to the class-file parser: magic number 0xCAFEBABE, version (65 = Java 21, and a newer one fails with UnsupportedClassVersionError), the constant pool, fields and methods. The result is an InstanceKlass in metaspace.
Linking. Verification checks, with the help of each method's StackMapTable, that the bytecode is type-safe: every instruction gets operands of the right types, the stack cannot overflow, jumps stay inside the method. The JDK's own classes are trusted and skip it. Preparation gives static fields their default values (counter = 0). Resolution is lazy: a symbolic reference like java/lang/System.out becomes a direct pointer when an instruction first uses it.
Initialisation runs <clinit>, the static initialisers, once, the first time the class is actively used (a static method call, a static field access, new). If it throws, the caller gets ExceptionInInitializerError and the class is unusable from then on (NoClassDefFoundError).
5. The first bytecodes
static {};                                   public static void main(java.lang.String[]);
   0: iconst_1                                  0: getstatic     #7    // System.out
   1: putstatic     #23  // counter             3: aload_0              // args
   4: return                                    4: iconst_0
                                                5: aaload               // args[0]
                                                6: invokedynamic #13   // makeConcatWithConstants
                                               11: invokevirtual #17   // PrintStream.println
                                               14: return
The interpreter is a stack machine: each method call has a frame with local variables (slot 0 is args) and an operand stack. "hello " + args[0] compiles (since Java 9) to invokedynamic. The first time it runs, its bootstrap method StringConcatFactory.makeConcatWithConstants builds the concatenation code from method handles and a generated hidden class, which loads about 93 more classes. The call site is linked once and later executions go straight to the code. println ends in the native FileOutputStream.writeBytes and a write(1, "hello world\n", 12) system call.
6. Interpreter and JIT
Every method starts in the interpreter, which counts invocations and loop iterations. A method that gets hot is compiled by C1 (quick, with profiling) and, if it stays hot, by C2 (slow, heavily optimised, using the profile). Even in this 16 ms run C1 compiled 39 small JDK methods (String.hashCode, String.length …, see -XX:+PrintCompilation). main runs once and is never compiled. For a program this short, -Xint or -XX:TieredStopAtLevel=1 make no difference; for a server that runs for days, the JIT is where the performance comes from. HotSpot JIT Tiers follows one hot method through the tiers, deoptimization and OSR.
7. The end
When main returns, JavaMain calls DestroyJavaVM. It waits until the "main" thread is the last non-daemon thread (the JVM's own threads are all daemons), runs shutdown hooks, and brings the VM down. System.exit(n) skips the waiting. This run never needed a garbage collection: the program allocated far less than the initial heap.
See it on your own machine
java -Xlog:class+load -jar hello.jar world          # every class, and where it came from
java -Xlog:startuptime -jar hello.jar world         # JVM startup phases
java -Xlog:gc*,cds -jar hello.jar world             # GC ergonomics, CDS mapping
java -Xshare:off -jar hello.jar world               # startup without CDS
java -XX:+PrintFlagsFinal -version | grep ergonomic # values the JVM chose for this machine
java -XX:NativeMemoryTracking=summary -XX:+UnlockDiagnosticVMOptions \
     -XX:+PrintNMTStatistics -jar hello.jar world   # reserved vs committed memory
strace -f -e trace=openat,clone3,mmap java -jar hello.jar world
javap -c -v Hello.class                             # the class file: constant pool, bytecode
Common startup errors
no main manifest attribute, in app.jar: the jar has noMain-Class. Build it withjar cfe, set it in Maven/Gradle, or runjava -cp app.jar com.example.Main.Error: Could not find or load main class Hello/ClassNotFoundException: a wrong class path, a missing package prefix (the name iscom.example.Hello, notHelloorcom/example/Hello.class), or the wrong working directory.UnsupportedClassVersionError … class file version 70.0 … up to 65.0: compiled for a newer Java than the one running it. Usejavac --release N.ExceptionInInitializerError: a static initialiser threw. Look at the "Caused by" line; any later use of the class throwsNoClassDefFoundError.- Killed or out of memory in a container: an old JVM (before 8u191) ignores cgroup limits and sizes its heap from the host's memory. Current JVMs don't;
-XX:MaxRAMPercentagetunes the fraction.
See also Spring Core: what a Spring application does after main starts, from component scanning to the first bean.