The sequel to How a Java Application Starts, which ends at the first bytecode of main, run by the interpreter. This page follows one hot method from there.
What the JIT does to a hot method
Every Java method starts in the interpreter, which counts how often the method is called and how often its loops go round. When the counts pass a threshold, C1 compiles the method quickly, with code that keeps counting and also records a profile: which classes arrive at each virtual call, which way each branch goes. When the method stays hot, C2 compiles it again, slowly and aggressively, and uses the profile to inline callees and to speculate: "this call only ever sees Square". When a speculation turns out wrong, the compiled code is thrown away (deoptimization), the method runs in the interpreter again, and it is compiled again with what it has learned.
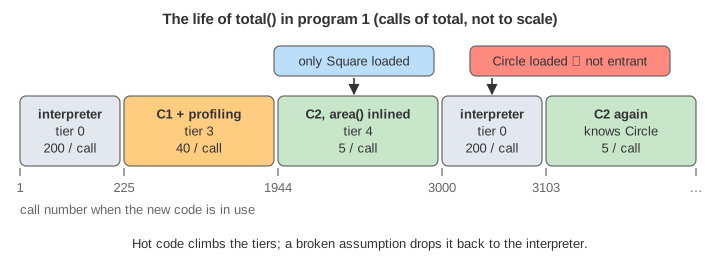
The page runs three small programs. The numbers on the canvas come from a model of HotSpot's tiered policy; the model was checked against real runs of the same programs on OpenJDK 17.0.16 (and C2 of JDK 21.0.8) with -XX:+PrintCompilation, -XX:+PrintInlining and -XX:+LogCompilation. With compilation made synchronous (-Xbatch) the model and the JVM agree call for call:
abstract class Shape { abstract double area(); }
final class Square extends Shape { final double s; ... double area() { return s * s; } }
final class Circle extends Shape { final double r; ... double area() { return 3.14159 * r * r; } }
class Late { static Shape circle(double r) { return new Circle(r); } }

static double total(Shape[] a) {                       // 27 bytes of bytecode
    double t = 0;
    for (int k = 0; k < a.length; k++)                 // 10 elements: 10 back-edges per call
        t += a[k].area();                              // invokevirtual Shape.area at bci 14
    return t;
}
public static void main(String[] args) {
    Shape[] sq = ten squares;
    for (int n = 0; n < 3000; n++) total(sq);          // phase 1
    Shape[] mix = five squares, five circles (Late.circle): Circle is loaded here
    for (int n = 0; n < 3000; n++) total(mix);         // phase 2
}
Call of total (-Xbatch) | OpenJDK 17, program 1 | On the page: queued / installed |
|---|---|---|
| 26 | Square::area tier 3 (256 calls: the check runs every 128) | 26 / 46 |
| 128 | Square::area tier 4 after 1024 more calls: C1 found nothing to profile in it | 128 / 228 |
| 205 | Demo::total tier 3: i = 205, b = 2048 (the 2nd back-edge check) | 205 / 225 |
| 1844 | Demo::total tier 4: i' = 1639, b' = 16384; Square::area inline (hot); tier 3 made not entrant | 1844 / 1944 |
| 3000 | Circle loaded: dependency_failed type='abstract_with_unique_concrete_subtype' ctxk='Shape' witness='Circle'; total@4 made not entrant | before call 3001 |
| 3025 | Demo::total tier 4 again, straight from the interpreter; Circle::area "executed < MinInliningThreshold times" | 3003 / 3103 |
| 3052 / 3256 | Circle::area tier 3 / tier 4 | 3052 / 3072, 3256 / 3356 |
In a normal run compiles are done in the background and finish some calls later; the page gives C1 20 calls and C2 100 calls (in program 3, 2000 and 10 000 loop iterations), so the numbers on the canvas are a little later than in the table.
Reading the canvas
- Top: the source and bytecode (
javap -c) of the hot method, with the interpreter's pc (▶) when Run 1 Step animates an interpreted call, and the call stack of themainthread. Frames are coloured by tier: grey interpreted, light blue C1 (tier 1), yellow C1 with profiling (tier 3), green C2 (tier 4). - Methods: for each method, its current code, the counters, the test for the next tier, how close it is, and when the policy will next look (only at counter overflows, see below).
iandbare the calls and loop back-edges counted by the interpreter;i'andb'are counted in the MDO (by tier-3 code, or by the interpreter once an MDO exists). - Profile: what the MDO of
totalhas recorded, the loaded subclasses ofShape, and what C2 did at the call site. - Compilers and code cache: the C1 and C2 queues and threads (one of each here; the 10-CPU machine of the capture had
CICompilerCount= 4: 1 C1 + 3 C2), and the compiled methods (nmethods) in the segmented code cache; ✗ marks code that has been made not entrant. - Warm-up chart: the cost of each call in illustrative units (an interpreted call of
totalcosts 200, a fully optimised one 5), with the totals of phase 1 in all three modes. Bars are coloured by the tiertotalruns at. - Log: lines in the format of
-XX:+PrintCompilation, newest at the bottom. The first column is the call number (the loop iteration in program 3), then the compile id and the tier.
A step is one call of total (programs 1 and 2) or 1000 loop iterations (program 3). Run to Next Event stops at the next compile, install, deoptimization or OSR; it is the way to watch the demos. A program tab starts that program at once, a change of mode starts the open program again in the new mode, and Reset starts it again as it is.
1. Why a JIT, and why two compilers
The interpreter is portable and starts at once, but compiled code is 10 to 50 times faster, and in a typical program only a few percent of the methods are hot. So HotSpot compiles only what the counters show to be hot. C1 (the "client" compiler) compiles fast and optimises simply. C2 (the "server" compiler) builds a sea-of-nodes graph, inlines deeply, removes checks, unrolls and vectorises loops, and takes ten or more times longer. Tiered compilation (the default since JDK 8) uses both: C1 early, for start-up, and C2 later, for peak speed. GraalVM's compiler can replace C2 (-XX:+UseJVMCICompiler).
2. Five tiers and when a method moves up
| Tier | Code | Counts / profiles |
|---|---|---|
| 0 | interpreter | counts calls and back-edges; profiles once the method has an MDO |
| 1 | C1, no profiling | nothing (trivial methods such as getters; everything with TieredStopAtLevel=1) |
| 2 | C1, counters only | calls and back-edges (used when C2's queue is long) |
| 3 | C1, full profiling | counters, receiver types, branches, in the MDO |
| 4 | C2 | nothing |
The normal path is 0 → 3 → 4; trivial methods go 0 → 1; when C2 is busy a method may go 0 → 2 → 3 → 4. With the default flags (JDK 17 and 21):
- 0 → 3 when
i ≥ 200(Tier3InvocationThreshold) ori ≥ 100 && i + b ≥ 2000(Tier3MinInvocationThreshold,Tier3CompileThreshold). A method with a loop gets there after fewer calls:totalat call 205,Square.areaafter 256 calls. - 3 → 4 when, counted in tier-3 code,
i' ≥ 5000ori' ≥ 600 && i' + b' ≥ 15000; and at once if C1 found nothing to profile in the method (no branches, no calls): that is whySquare.areareaches C2 after 1280 calls, not 5000. - OSR when a loop has made
b ≥ 60000back-edges (tier 3) orb' ≥ 40000(tier 4).
The counters are not checked on every call. The interpreter only calls the policy when a counter passes a multiple of 27 = 128 (calls, Tier0InvokeNotifyFreqLog) or 210 = 1024 (back-edges, Tier0BackedgeNotifyFreqLog); tier-3 code every 210 calls and 213 = 8192 back-edges. So total passes i + b ≥ 2000 at call 182, but nobody looks until b = 2048 at call 205; and it passes the tier-4 test at about i' = 1364, but is only queued at b' = 16384. The methods table shows when the next check will be. The thresholds grow with the length of the compile queues (Tier3LoadFeedback, Tier4LoadFeedback); the page's queues are short, so they stay at the defaults.
Compilation is asynchronous. A compile request goes into a queue; a compiler thread takes it, and until the new code is installed the method keeps running in its old tier. -Xbatch makes the calling thread wait instead, which is useful for experiments like the table above.
Without tiers. -XX:-TieredCompilation uses C2 only: the interpreter both counts and profiles, and a method is compiled after CompileThreshold = 10000 calls (plus back-edges). Start-up is slower, since nothing is compiled for a long time; the page leaves this mode to this paragraph.
3. Profiling: the MDO
The MethodData object (MDO) is created when C1 starts a tier-3 compile. Tier-3 code (and the interpreter, once the MDO exists) records in it: call and back-edge counts, which way each branch went, the receiver classes seen at each virtual and interface call (two rows per call site, TypeProfileWidth), whether a null was seen, and how often each kind of uncommon trap happened. All that bookkeeping makes tier-3 code about 30 % slower than tier-1 code. It is what C2 lives on: without a profile it could not know that a[k] is always a Square.
4. Inlining
Inlining copies the callee's body into the caller. It saves the call, but its real value is that the optimiser now sees both methods as one: area() inside the loop becomes a load and a multiply, and the loop can be unrolled; escape analysis, constant folding and range-check elimination all work across the former call. C2 inlines a callee of up to MaxInlineSize = 35 bytes, or up to FreqInlineSize = 325 bytes if it is hot, down to MaxInlineLevel levels. In JDK 17 a callee must also have run at least MinInliningThreshold = 250 times: in the capture, the recompiled total calls Circle.area (run 120 times so far) instead of inlining it; JDK 21, which dropped that rule, inlines both.
A virtual call can only be inlined if the compiler knows the target. With one possible target (class hierarchy analysis, below) no check is needed. Otherwise the profile decides: one receiver class seen (monomorphic): inline behind a type check; two (bimorphic): two checks; more (megamorphic): a normal virtual call through the vtable, unless one class has at least 90 % of the calls.
5. Speculation and deoptimization
C2 compiles for what has happened, not for everything that could happen, and it keeps a way back:
- Dependencies (program 1). When
Shapehas one loaded concrete subclass,a[k].area()can only beSquare.area. C2 inlines it with no check at all and records the dependencyabstract_with_unique_concrete_subtype Shape → Square. WhenCircleis loaded, HotSpot checks every dependency onShapeand makes the dependent code not entrant at once: no new call can enter it. If a thread were running it, its frame would be deoptimized too. - Guards and uncommon traps (program 2). With
Circleloaded early, CHA cannot help, but the profile has seen only squares. C2 inlinesSquare.areabehind the checka[k].getClass() == Square, and compiles no code for the other case: it becomes an uncommon trap. When aCirclearrives (call 3001, element 5), the trap runs: the compiled frame is deoptimized, rebuilt as an interpreter frame at bci 14 from the debug information C2 saved (which bytecode, wheret,kandalive), and the rest of the call is interpreted. Traps have a reason (class_check,null_check,unstable_if,range_check…) and an action; heremaybe_recompile: the code stays in use until the same bci has trappedPerBytecodeTrapLimit= 4 times (calls 3001 to 3004), then it is made not entrant. AfterPerMethodTrapLimit= 100 traps C2 stops speculating in the method at all. - Recompilation. The MDO survives the deoptimization. Its counts already pass the tier-4 test, so at the next check (every 128 calls) the policy sends
totalstraight back to C2, without tier 3 (in the capture at call 3025 in program 1 and 3029 in program 2; on the page, where the MDO counted a little longer in the interpreter while C1 worked, at 3003 and 3005). C2 now sees Square and Circle in the profile and records that the class check has trapped too often: it compiles two type checks, and a virtual call instead of a trap for any third class.
![At bci 14 the C2 code checks a[k].getClass() == Square: yes runs the inlined s * s; no, a Circle, hits an uncommon trap that deoptimizes the frame into an interpreter frame at bci 14; after 4 traps the code is made not entrant and recompiled with both classes](Images/jittiering/uncommon-trap.svg)
The first attempt used an interface (interface Shape) and created the circles in main itself. That does not show a dependency: C2 does not trust interface types for CHA ("we cannot trust interface types, yet"), and the verifier loads Circle when it checks main. Both versions took four class_check traps instead. The Late class keeps Circle unloaded until phase 2.
A megamorphic call site, or code that keeps trapping, can therefore end up slower than you expect: C2 gives up speculating and the call stays virtual. Microbenchmarks that warm up with one class and measure with another measure exactly this.
6. On-stack replacement
In program 3 all the work is one loop in main, which is called once. Compiling main "for the next call" would not help. Instead, at iteration 60 416 (b ≥ 60 000, seen at the 59th back-edge check) the policy queues an OSR compile: code that is entered in the middle of the loop, at its header (bci 2). At a later back-edge check the interpreter finds it and migrates: it copies the frame's locals into an OSR buffer and jumps into the compiled loop. -XX:+PrintCompilation marks these compiles with %:
     40    6 %  b  3       Demo::main @ 2 (41 bytes)        iteration 60 416: C1, OSR at bci 2
     40    7    b  3       Demo::main (41 bytes)            and main itself, at the same tier
     40    8 %  b  4       Demo::main @ 2 (41 bytes)        iteration 101 376: b' = 40 960 → C2
     42    6 %     3       Demo::main @ 2 (41 bytes)   made not entrant
     42    8 %     4       Demo::main @ 2 (41 bytes)   made not entrant    the loop exit: an uncommon trap
# the same run with JDK 21 and -Xlog:deoptimization=debug also prints the trap:
[deoptimization] cid= 202 osr level=4 Demo.main([Ljava/lang/String;)V trap_bci=5 osr_bci=2 unstable_if reinterpret
The C1 OSR frame cannot jump straight into the C2 OSR code: it is deoptimized (reason constraint) and the interpreter enters the C2 code at its next check, 1024 iterations later. At the end of the loop, the C2 code hits an uncommon trap: while C1 profiled the loop its exit branch was never taken, so C2 compiled no exit, only a trap (unstable_if). OSR code is also less optimised than a normal compile: the loop's entry state comes from the interpreter, so fewer facts are known. On the page, with compile times, the same happens later: OSR queued at iteration 60 416 and entered at 62 464, C2 OSR queued at 101 376 and entered at 118 784, the trap at 200 000.
7. The code cache
Compiled code lives in the code cache, 240 MB of address space reserved at start-up (ReservedCodeCacheSize; see the memory column of the start-up page). Since JDK 9 it is split into three segments: non-nmethods (the interpreter, stubs and adapters, 5.6 MB), profiled (tier 2 and 3 code, 117 MB) and non-profiled (tier 1 and 4, 117 MB), so that short-lived profiled code does not fragment the long-lived C2 code. The nmethod sizes on the canvas are from the capture: total 1416 bytes at tier 3, 1160 at tier 4 (CHA) and 1024 after recompilation. Code that is made not entrant is freed later, once no frame uses it (by the sweeper in JDK 17, by the GC's unloading since JDK 20; see the GC page). If the cache fills up, the JVM prints "CodeCache is full. Compiler has been disabled" and the application runs on, interpreted and slow.
Tiered, C1 only, interpreter only
The chart's totals compare phase 1 (3000 calls of total with squares) in the three modes: tiered 106 375, C1 only 141 520, -Xint 600 000 units (5.6 × tiered). -Xint never compiles. -XX:TieredStopAtLevel=1 compiles with C1 only, at the same counts as tier 3 but without profiling: from call 225 on a call costs 40 units, and it stays there. Tiered code costs the same 40 while total runs its profiling tier-3 code (calls 225 to 1943), then C2 brings it down to 5. The longer a program runs, the more that peak matters; in phase 2 the C1-only run falls further behind (264 360 against 152 610 for all 6000 calls). For a short-lived tool, C1 only (or CDS and AOT, below) can win.
See it yourself
java -XX:+PrintCompilation Demo                        # every compile: id, % (OSR), tier, made not entrant
java -XX:+UnlockDiagnosticVMOptions -XX:+PrintInlining -XX:+PrintCompilation Demo
java -Xlog:jit+compilation=debug Demo
java -Xlog:deoptimization=debug Demo                   # JDK 21 (not in 17): every uncommon trap
java -XX:+UnlockDiagnosticVMOptions -XX:+LogCompilation -XX:LogFile=jit.xml Demo   # everything, for JITWatch
java -Xbatch -XX:+PrintCompilation Demo                # synchronous compiles, reproducible
java -XX:TieredStopAtLevel=1 Demo · java -Xint Demo    # the other two modes
jcmd <pid> Compiler.codelist · Compiler.queue · Compiler.codecache
Benchmarks need warm-up for exactly the reasons on this page, which is why JMH runs warm-up iterations in fresh JVMs. Start-up itself is attacked from the other side: Class Data Sharing, Project Leyden's AOT cache (JDK 24+, which can also keep profiles), CRaC (checkpoint a warmed-up JVM) and GraalVM Native Image.
What the animation leaves out
- One C1 and one C2 thread with fixed compile times counted in calls; real compiles take microseconds to milliseconds and depend on the method (the capture's machine had
CICompilerCount= 4: 1 C1 and 3 C2 threads). - The MDO is created when C1 starts a tier-3 compile, as in HotSpot; its start counters (the "delta" HotSpot subtracts) are left out.
- No tier 2, no queue-length scaling of the thresholds, no code-cache pressure, no
maincompile in programs 1 and 2 (it never gets hot enough), no null or range checks in the traps. - Costs per call are illustrative, not measured; the nmethod sizes are real.
- Only JDK 17's inlining rule is modelled (
MinInliningThreshold); JDK 21 would inlineCircle.areaafter the recompile.