The idea: two different questions
Latency answers "how long does one request take?". Throughput answers "how many requests are finished per second?". They are measured in different units (milliseconds vs requests per second) and they are not two ends of one scale: a server can have both good latency and good throughput, or be good at one and bad at the other. What links them is the queue in front of the server.
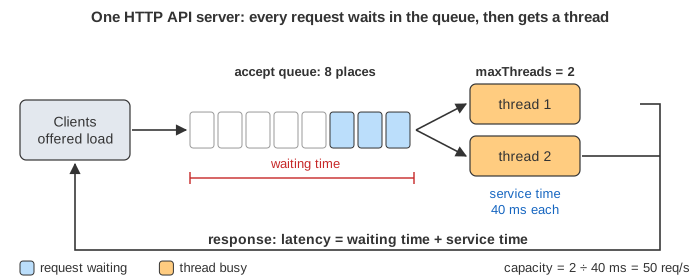
The page runs one HTTP API server. Clients send requests at a chosen rate (the offered
load). The server has an accept queue with 8 places (Tomcat calls it acceptCount)
and a pool of worker threads (maxThreads). Each request needs 40 ms of work. Time moves
in ticks of 10 ms. Every request is a coloured box: you can follow it from the clients, through the
queue and a thread, back to the clients with its latency written on it.
Where latency comes from
A request's latency is waiting time + service time. The service time (40 ms here) is the work itself. The waiting time is the time spent in the queue because every thread was busy. At light load nobody waits, so latency = service time (Demo: light load: 12 requests, all 40 ms). Almost all of the growth in latency under load is waiting, not slower work.
The throughput ceiling
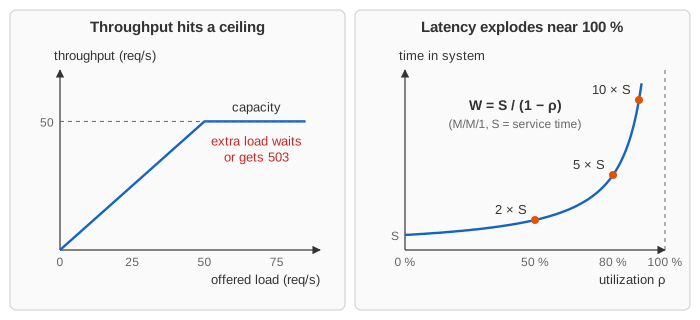
A thread that needs 40 ms per request can finish at most 25 requests per second. With 2 threads the capacity is 2 ÷ 40 ms = 50 req/s. Utilization is the share of time the threads are busy: offered load ÷ capacity. Below capacity, throughput equals the offered load. At and above it, throughput stays at the ceiling however much more is sent (Demo: overload: 70 req/s offered, 50 req/s served). The extra requests pile up in the queue, and every place in the queue adds 20 ms of waiting (one place = one request ahead of you, and two threads clear one every 20 ms).
Why queues form before 100 %
With perfectly even arrivals, 50 req/s on a 50 req/s server works: each request arrives exactly when a
thread becomes free, and nobody waits (Demo: exactly at capacity). Real traffic comes in bursts.
With random arrivals at 40 req/s (80 % utilization) some requests arrive together, find both threads
busy and wait: the median stays at 40 ms, but p99 reaches 100 ms (Demo: random arrivals). Queueing
theory makes this exact: for a single server with random arrivals and random service times (M/M/1),
the mean time in the system is W = S / (1 − ρ), where ρ is utilization. At 50 % that is
2 × S, at 80 % 5 × S, at 90 % 10 × S, at 99 % 100 × S. That curve is the "hockey stick": flat, then
almost vertical near 100 % (Demo: the hockey stick).
Little's Law
L = λ · W: the average number of requests in the system (L) equals the arrival rate (λ) times the average time each one spends there (W). It holds for any queue in a steady state, whatever the arrival pattern or the order of service. The page measures all three for each run and shows that they match. It is useful in both directions: 200 requests in flight at 40 ms each means about 200 ÷ 0.04 s = 5 000 req/s; to serve 1 000 req/s at 50 ms you need at least 50 requests in flight (50 threads, or 50 connections in a pool).
Buying throughput, and what it costs in latency
Parallelism (more threads, more servers) raises the ceiling. It does not make a single request faster: at 4 threads every request still takes 40 ms, but now 70 req/s go through without waiting (Demo: more threads). Batching raises the ceiling by paying a fixed cost once for many requests. Here a batch costs 30 ms + 10 ms per request, so one thread can do 4 requests in 70 ms (57 req/s) instead of 4 × 40 ms. The price is waiting for the batch to fill: at 20 req/s each request now takes 70 ms instead of 40 ms. At 50 req/s the batching thread keeps up (p99 100 ms, nothing refused), while the same thread without batching (25 req/s) overflows: p99 340 ms and 7 of 30 requests refused (Demo: batching).
| Technique | Throughput | Latency | Examples |
|---|---|---|---|
| More workers / servers | up (higher ceiling) | same per request; less waiting under load | thread pools, horizontal scaling, sharding |
| Batching | up (fixed cost shared) | worse at low load (wait for the batch) | Kafka producer linger.ms / batch.size, database group commit, Nagle's algorithm, GPU batch inference |
| Pipelining | up (stages overlap) | same or slightly worse per item | CPU pipelines, HTTP/2 multiplexing, Redis pipelining |
| Caching | up | down (less work per request) | CDN, Redis, CPU caches |
| Bounded queue + reject | same | capped (errors instead of waiting) | acceptCount, 503, load shedding |
Tail latency: why p99 matters
The p50 (median) is the latency half of the requests beat; the p99 is the one 99 % beat. The average hides the tail. One slow request (a GC pause, a cold cache, a lock) holds a thread for 300 ms. The requests queued behind it wait too, because the other thread has to serve everyone at half the capacity (Demo: one slow request). The tail matters more than it seems: a page that calls 100 services, each with a 1 % chance of being slow, is slow 63 % of the time.
Back-pressure: rejecting early
An unbounded queue under overload grows until memory runs out, and every request in it is too late
to be useful. A bounded queue (8 places here) caps the waiting at about 160 ms and answers the rest at once
with 503 Service Unavailable, which a client can retry elsewhere or later. That is why the
hockey stick on this page stops rising at about 190 ms: past the ceiling, extra load turns into 503s,
not into longer waits.
See also CPU Scheduling (waiting time and turnaround for the
same kind of queue), How Kafka Moves a Message (producer batching with
linger.ms), nginx Proxy Request,
The Node.js Event Loop (one thread: a blocking task stalls every request),
How TCP Congestion Control Works (throughput vs delay on a network path)
and TCP vs UDP.
What the page leaves out
Network latency and bandwidth (the time on the wire, and bytes per second as the network's throughput) are not drawn: the requests appear at the server at once. Service times are fixed, not random; real servers slow down when overloaded (contention, cache misses, GC), so real curves turn up even more sharply. Clients here send at a fixed rate whatever happens (an open system); closed-loop clients that wait for each answer hide the queueing delay, a measurement mistake called coordinated omission. Priorities, timeouts, retries (which add load exactly when the server is overloaded), autoscaling and concurrency limits in clients are also left out.