The idea: many rare chances add up to a Poisson count
Flip 10 coins that each land heads with probability 0.3 and count the heads. The count k follows the binomial distribution Binomial(10, 0.3), with 3 heads on average. Now flip 100 coins with probability 0.03 each: still 3 heads on average, but each head is a rare event. Push this further, more coins and a smaller chance each, with the average λ = np held fixed, and the count settles on the Poisson distribution Poisson(λ).
The canvas flips the coins with a seeded random generator, draws both PMFs side by side for k = 0 to 12 and puts a navy mark at the share of experiments that gave k heads. The table lists the exact numbers. Demo: one experiment, 10 coins follows one count from the coins to the chart.
The binomial PMF
A run of n flips with exactly k heads can put the heads in C(n, k) different places, and each such run has probability pk(1−p)n−k. So
P(X = k) = C(n, k) · p^k · (1 − p)^(n − k),   k = 0 … n
mean = np        variance = np(1 − p)
For n = 10, p = 0.3: P(X = 3) = 120 · 0.027 · 0.0824 = 0.2668. After 1000 seeded experiments the observed shares sit within about 0.02 of the blue bars (Demo: 1000 experiments trace the binomial). The coefficients C(n, k) are the rows of Pascal's triangle.
Taking the limit n → ∞ with np = λ
Put p = λ/n into the binomial PMF and let n grow with k fixed:
- C(n, k) · pk = n(n−1)…(n−k+1)/k! · λk/nk → λk/k!, because each factor (n−i)/n → 1;
- (1 − λ/n)n → e−λ, the definition of e;
- (1 − λ/n)−k → 1.
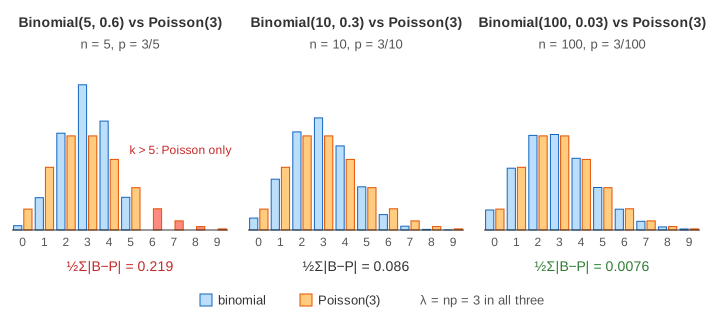
P(X = k) → e^(−λ) · λ^k / k! (Poisson, mean = variance = λ)This is the Poisson limit theorem, also called the law of rare events (Demo: n → ∞ with λ = 3 steps n through 5, 10, 20, 50, 100).
How close is close
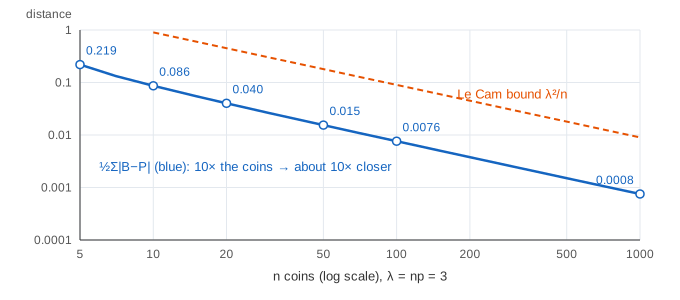
The page measures the gap as the total variation distance d = ½Σk|B(k) − P(k)|: the largest difference in probability the two models can give any event.
| n | p = 3/n | variance np(1−p) | B(3) | P(3) | d |
|---|---|---|---|---|---|
| 5 | 0.6 | 1.20 | 0.3456 | 0.2240 | 0.219 |
| 10 | 0.3 | 2.10 | 0.2668 | 0.2240 | 0.086 |
| 20 | 0.15 | 2.55 | 0.2428 | 0.2240 | 0.040 |
| 50 | 0.06 | 2.82 | 0.2311 | 0.2240 | 0.015 |
| 100 | 0.03 | 2.91 | 0.2275 | 0.2240 | 0.0076 |
Ten times the coins gives about ten times closer. Le Cam's inequality makes this precise: d ≤ np² = λ²/n. A common rule of thumb is to use Poisson for a binomial when n ≥ 20 and p ≤ 0.05.
Mean and variance
Both models have mean λ. The binomial variance np(1−p) = λ(1 − p) is smaller than Poisson's λ, so for a large p the binomial is narrower and taller: 2.10 against 3 at n = 10, 2.91 against 3 at n = 100 (Demo: mean and variance). "Variance equals mean" is a quick test of whether count data look Poisson.
Where the approximation breaks
With n = 5 and λ = 3 each coin lands heads 60% of the time: these are not rare events. Five coins can give at most 5 heads, yet Poisson(3) puts P(X > 5) = 0.0839 on 6 or more (Demo: p too big, Poisson spills past n). For a large p, the normal distribution with mean np and variance np(1−p) is the better approximation, as the central limit theorem predicts.
Where Poisson counts show up
Any count of many independent chances that are each unlikely: requests to a server per second, typos per page, calls to a help desk per minute, radioactive decays per second. One person in 100 clicking an ad is Binomial(100, 0.01), and with λ = 1 it is already within 0.003 of Poisson(1) (Demo: rare events, λ = 1, n = 100). The time between Poisson events follows the exponential distribution.
Adding up PMF bars gives a staircase CDF: see PDF vs CDF.
The time between Poisson events follows the exponential distribution, and it is memoryless.
See also Discrete Distributions for the six common PMFs side by side.
What the page leaves out
- Poisson processes in continuous time (the waiting times between events are on exponential waiting times).
- Other limits: Binomial → normal for large np(1−p), Poisson → normal for large λ.
- Coins with different probabilities pi (Le Cam's bound Σpi² still holds).
- Fitting λ to data and testing whether data are Poisson (dispersion test, chi-square).
- Counts above 12, which the chart and table do not draw.